EMA RSI ATR Hidden Div Strat - 1 MinHey there!
Hereby I present you the EMA RSI Lowest Low Hidden Divergence strategy, which I discovered on a youtube channel.
He has tested the strategy hundreds of times manually, herewith I try to automate the whole thing.
Since I use the strategy with a bot, it can only enter long positions for now. But in the future I will add the possibility to trade short positions.
The strategy was tested with BTC/ USDT in 1m chart (8 days). The values must be adjusted depending on the timeframe and coin.
-----------------------------------------------------------------------------------
How does the strategy work?
First of all, we need a bullish hidden divergence.
Once this is detected, the following parameters are checked:
The 50 EMA must cross the 250 EMA .
Then, the candle must close above the 50 EMA .
The K line of the RSI STOCH indicator need to crosses the D line.
If the next candle closes above the 50 EMA , a long position is opened.
The stop loss is determined with the "lowest low/highest high lookback".
The profit factor is multiplied by the value of the lowest low/highest high lookback.
The results of the strategy are without commissions and levers.
If you have any questions or feedback, please let me know in the comments.
In the future I will add other types of stop loss / take profits. (ATR; %; eg.)
I wish you good luck with the strategy!
Cari dalam skrip untuk "take profit"

Tripple super Trend + EMA + RSI StrategyGreetings!
Here I show you the Tripple Super Trend Strategy.
I discovered the strategy on a YouTube channel and tried to transfer it as a strategy into a script.
Tested with the currency pair EUR/USD in the one hour chart.
Period: beginning of 2020 until today.
The strategy should also work with cryptocurrencies. But then the settings have to be adjusted.
There is the possibility to activate only long or only short position.
The EMA can be used in a time different from the chart.
-----------------------------------------------------------------------------------
How does the strategy work?
For long positions, the candle must be above the EMA .
The candle must be closed above at least two of the supertrend lines.
The stochastic RSI must show oversold and the k line must cross over the D line.
For short positions, the candle must be below the EMA .
The candle must be closed below at least two of the supertrend lines.
The stochastic RSI must indicate overbought and the K line must cross below the D line.
The stop loss is determined with the "lowest low/highest high lookback".
The profit factor is multiplied by the value of the lowest low/highest high lookback.
The results of the strategy are without commissions and levers.
If you have any questions or feedback, please let me know in the comments.
In the future I will add other types of stop loss / take profits. (ATR; %; eg.)
If you need more information about the strategy and want to know exactly how to apply it, check out my profile.
I wish you good luck with the strategy!

Bollinger Bands strategy with RSI and MACD v1.0 This is a strategy based on the Bollinger Bands, where buy trades are made when the price crosses the lower line of the Bollinger Bands upwards, and sell trades are made when the price crosses the upper line downwards.
In addition, it is possible through the inputs to enable trading with RSI and MACD, so that buy or sell trades are supported by these two indicators.
Trades are partially and fully closed in the following way, a buy trade will close half of the position when the price touches the middle line of the Bollinger bands and will be fully closed when the price touches the upper band. In the case of a sell position, half of the position will be closed if the price touches the middle band and the entire position will be closed when the price touches the lower band. Alternatively, a fixed take profit can be placed. In case the price moves against us, trailing stops can be placed.
In case of selecting to use RSI, MACD, or MACD variation, trades will be executed as long as The Bollinger Bands, and all the above-mentioned indicators give the same signals, either buy or sell.
For example in the case of selecting only Use RSI, buy trades would be made as long as RSI and BB give buy signals.
Strategy inputs:
-BB source: Bollinger Bands price source.
-Bollinger Bands SMA length: Bollinger Bands simple moving average length.
-Bollinger Bands StdDev length: Bollinger Bands standard deviation length.
-Trail Long Loss (%): Distance in percentage at which the stop loss will initially be placed for buy trades.
-Trail Short Loss (%): Distance in percentage at which the stop loss will be initially placed for sell trades.
-Maximum orders: Maximum of simultaneous operations, for example, if it is 3, up to 3 parallel operations of buy and up to 3 parallel operations of sell will be carried out.
-Position size: Number of contracts per trade.
-Use RSI: If selected, the strategy will also trade based on oversold or overbought signals provided by the RSI.
-RSI source: RSI price source.
-RSI period: The RSI period to use.
-RSI value for buy: If the RSI is below this value, it will give a buy signal.
-RSI value for sell: If the RSI value is above this value, it will give a sell signal.
-Use MACD: If selected, buy trades will be made when the MACD crosses 0 upwards, and sell trades will be made when the MACD crosses 0 downwards.
-Use MACD variation: Only available if MACD is previously selected. In this case, buy trades are made if the MACD value in the last 3 candles has been decreasing, and sell trades are made if the MACD value has been increasing.
-MACD source: MACD price source.
-MACD fast length: MACD fast EMA lenght.
-MACD slow length: MACD slow EMA lenght.
-MACD signal length: MACD signal EMA lenght.
-Use maximum TP long: If selected, a fixed take profit will be placed for buy trades. The position could be closed before reaching this take profit if the price touches one of the lower or upper lines first.
-Maximum take profit long (%): Distance in percentage at which the take profit will be placed for buy trades.
-Use maximum TP short: if selected, a fixed take profit will be placed for sell trades. The position could be closed before reaching this take profit if the price touches one of the lower or upper lines first.
-Maximum take profit short (%): Distance in percentage at which the take profit will be set for sell trades.
I hope you like it and as always all feedback is welcome.

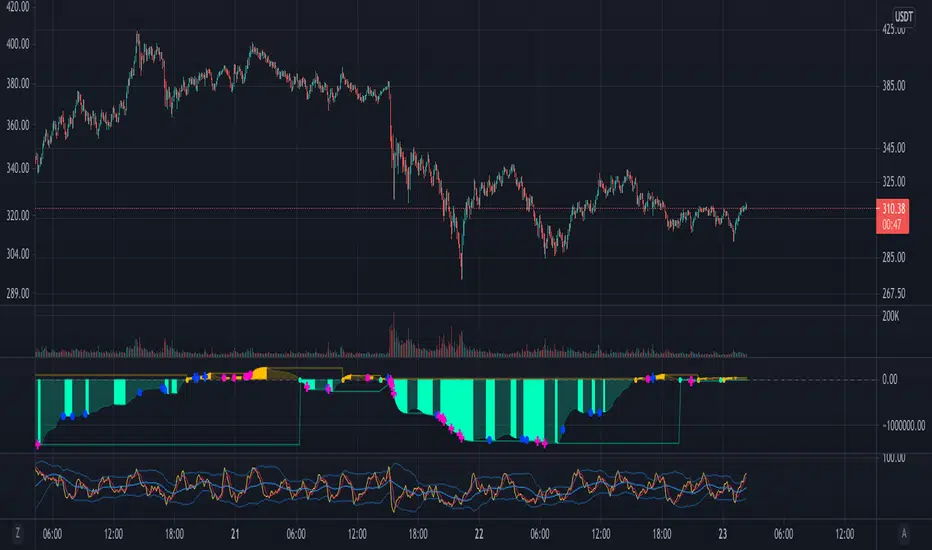
Market Maker BalanceWhere is the market maker in his cycle of building longs or shorts? When is that big drop or big pump coming?
This is a simple and unexpectedly powerful indicator that shows you an estimate of the market maker's position over the last 200 candles. It works on any timeframe.
How does it work?
It combines a simple 10-candle Price Volume Support Resistance Analysis metric of climactic and rising volume. That volume is combined to create a bullish and bearish balance over a period of 200 candles. The curves are smoothed out with a 10 period EMA.
The MMB (Marker Maker Balance) oscillator is the resulting bearish volume - bullish volume, which shows us THEIR position balance.
Indications:
when shorts are increasing (further below 0), we are in a bullish trend -- you should be taking profit on longs
when shorts are flat or decreasing, the trend is due for a reversal -- you should be closing longs and looking to short
when shorts cross 0 to long, the trend is reversing down -- you should be in a short position by now
when longs are increasing, we are in a bearish trend -- you should be taking profits on your shorts
when longs are flat or decreasing, the trend is due for a reversal -- you should be closing your shorts
For extra information, there are also the separate lines for rising and climactic volume to give you early indications of reversal or change in Market Maker behaviour. You can disable them in the Style settings, but they can be a useful early indicator that the current trend is losing strength when rising volume overtakes climax volume (MM's no longer moving out of zones higher/lower).
Ways to use this indicator are quite simple and eerily accurate:
for short term gains, do the opposite of MMs: long when MM are opening more shorts, short when they are opening more longs
for huge positions, mimic the MM position: build long positions / close shorts when MMB is rising, build shorts / close longs when MMB is falling or crosses above 0 (be careful with leverage, begin on 1x leverage)
Note: the results of this indicator will be different for each exchange, because of their different trading volumes per candle. It's advisable to use it for the exchange you're trading on or use a chart that averages all exchanges for that asset, like INDEX:BTCUSD.
For those of you who use the Backtesting & Trading Engine by PineCoders, the BTE Signal plot generates long and short entries as well as filter states. Use this plot as the source for BTE.
Shout out to @infernixx for PVSRA calculations in his awesome Traders Reality indicator, the code of which I shamelessly ripped off and edited for this indicator.
Leave comments below if you want something added.
Bollinger Bands Trending Reverse StrategyWelcome to yet another script. This script was a lot easier since I was stuck for so long on the Donchian Channels one and learned so much from that one that I could use in this one.
This code should be a lot cleaner compared to the Donchian Channels, but we'll leave that up to the pro's.
This strategy has two entry signals, long = when price hits lower band, while above EMA, previous candle was bearish and current candle is bullish.
Short = when price hits upper band, while below EMA, previous candle was bullish and current candle is bearish.
Take profits are the opposite side's band(lower band for long signals, upper band for short signals). This means our take profit price will change per bar.
Our stop loss doesn't change, it's the difference between entry price and the take profit target divided by the input risk reward.

MACD Crossover trend strategy, Long and ShortHey everybody,
This is my first strategy and script I wrote mostly myself. There's tons of content out there to learn how to code in Pinescript and it's exactly what I wanted and needed in this time of my life.
In any case, I made a rather simple MACD crossover strategy that only takes trades in the direction of both EMA and SMA (there are inputs to change the length of the moving averages and lots of other stuff too).
If the MACD line crosses upwards on the signal line, while above the zero point of the histogram and the price is above EMA + SMA , it's a long signal.
If the MACD line cosses downards on the signal line, while below zero on the histogram and the price is below EMA + SMA , it's a short signal.
There are a lot of default variables that make no sense, for basically any symbol you're going to be looking at. You're going to have to adjust the EMA , SMA , backtest date, take profit, stop loss and all that good stuff yourself to find decently profitable parameters.
I made this myself because I couldn't really find a strategy out there that allowed for so much customizing and it's an easy way to get started in Pinescript.
If you have any suggestions, tips or you see a flatout mistake in my code, please let me know. I'm still learning, everyday and I'm enjoying every second of it.

Flawless Victory Strategy - 15min BTC Machine Learning StrategyHello everyone, I am a heavy Python programmer bringing machine learning to TradingView. This 15 minute Bitcoin Long strategy was created using a machine learning library and 1 year of historical data in Python. Every parameter is hyper optimized to bring you the most profitable buy and sell signals for Bitcoin on the 15min chart. The historical Bitcoin data was gathered from Binance API, in case you want to know the best exchange to use this long strategy. It is a simple Bollinger Band and RSI strategy with two versions included in the tradingview settings. The first version has a Sharpe Ratio of 7.5 which is amazing, and the second version includes the best stop loss and take profit positions with a Sharpe Ratio of 2.5 . Let me talk a little bit more about how the strategy works. The buy signal is triggered when close price is less than lower Bollinger Band at Std Dev 1, and the RSI is greater than a certain value. The sell signal is triggered when close price is greater than upper Bollinger Band at Std Dev 1, and the RSI is greater than a certain value. What makes this strategy interesting is the parameters the Machine Learning library found when backtesting for the best Sharpe Ratio. I left my computer on for about 28 hours to fully backtest 5000 EPOCHS and get the results. I was able to create a great strategy that might be one of TradingView's best strategies out on the website today. I will continue to apply machine learning to all my strategies from here on forward. Please Let me know if you have any questions or certain strategies you would like me to hyper optimize for you. I'm always willing to create profitable strategies!
P.S. You can always pyramid this strategy for more gains! I just don't add pyramiding when creating my strategies because I want to show you the true win/loss ratio based buying one time and one selling one time. I feel like when creating a strategy that includes pyramiding right off the bat falsifies the win rate. This is my way of being transparent with you all. Have fun trading!

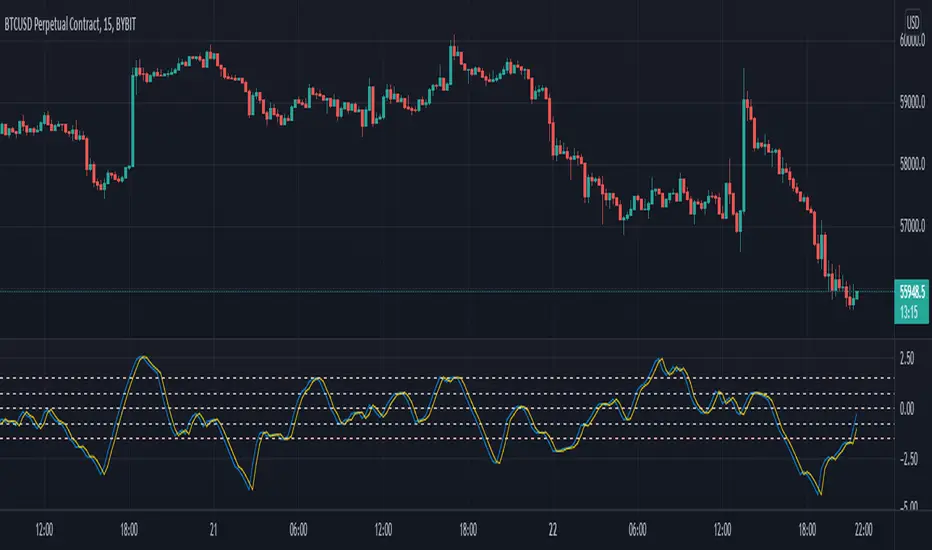
ema exhaustion (exa)The exa is an oscillator that combines fisher transform with distance from moving average and it is based on a theory that exhaustion can be derived from how far price is able to extend from a moving average, on average.
The fisher transform converts price into a gaussian normal distribution, also known as a bell curve {1}. A normal distribution is a type of probability distribution for a real-valued random variable {2}. Applying this method to the price of an asset can help to identify probabilities, but it will never identify certainties.
‘exa’ is an abbreviation for ema exhaustion. It can be used to identify when price is probable to revert to the mean but I prefer using it to confirm entries that are signaled following a reversion to the mean (aka buying the dip in bull markets). When price gets oversold into support, in a bull trend, then that can provide a good opportunity to enter long. However that isn’t necessarily the case when the same metrics indicate oversold conditions in a bear trend. In this situation the exa is best suited for identifying profit taking opportunities on shorts.
The default settings are a 9 lookback period and a 50 ema. By default signals will be derived from how far price is from the 50 ema relative to the probable distribution of the last 9 periods. If the exa is above 2, or below -2, then the price is in the 80th percentile of the prior 9 candles. Being outside of 3, or -3, represents the 90th percentile and 4, or -4, represents the 95th percentile.
Those ranges will never indicate a necessity of reverting to the mean, but they will indicate a higher and higher probability. I prefer to use this oscillator in combination with an indicator(s) that identifies the trend. When the oscillator reaches -2 in a bull trend then it can confirm long entry signals, whereas if it reaches +2 in a bull trend then it can be used to confirm signals to take profit.
Crossovers are especially significant because they indicate a shift in the tide. When the exa reaches 2 without crossing over then it is very much in a position to move to 3 or 4+. When it crosses above 2 then it is an indication that price is extended from the mean and exhausted.
This is certainly not a situation that implies price will revert to the mean, it simply provides confirmation.
The default settings are what I have been finding most effective personally, however that is mostly a function of the trend following tools that I use. The same principles should apply with all settings and I would encourage users to experiment with various lookback periods and emas.
{1} www.investopedia.com
{2} en.wikipedia.org
Grid Bot SimulatorThis script is a grid bot simulator for ranging/choppy markets. Prices are divided into grids, or trade zones, that will trigger signals each time a new zone is entered. During ranging markets, each transaction is followed by a “take profit.” As the market starts to trend, transactions are stacked (compare to DCA), until the market consolidates. No signals are triggered above the Upper Limit or Below the Lower Limit.
Settings overview:
Upper Limit/Lower Limit : Highest and Lowest values for entire grid.
Number of Grids : Number of trade zones.
Show Grids : Show or hide all gridlines.
Show Only Current Grids : Only display the grids just above and just below the current trade zone.
High/Low for signals : If enabled, signals are triggered as soon as the price touches the next zone. If disabled, signals are triggered after bar closes. Enable this for “Once Per Bar alerts. Disable for “Once Per Bar Close” alerts.
Highlight Trade Zones
The grid bot should work well during ranging/choppy markets. Each zone will have only one trade, and then will immediately take profit in the next zone.
Ranging/Choppy Market
However, trending markets can produce multiple signals in rapid succession:
Trending Market
If the gridlines are compressing the chart space, enable the “Show Only Current Grids” in settings.
Show Only Current Grids disabled
Show Only Current Grids enabled
When changing symbols, adjust the Upper and Lower Limits to accommodate the new symbol. Otherwise, the chart will look compressed.
XBTUSD chart with ETHUSDT settings
The bot is a proof-of-concept and is considered experimental . Possible future updates will include Fibonacci grids and “smart entry/exits,” depending on the current trend. Comments and suggestions are encouraged.

Triple SMA Strategy with entries based on sma price closesHi! :)
This strategy is made for intraday trades, especially on 5 sec - 5 min charts to follow the trend.
I have not tested on higher timeframes, but feel free to play with the values.
I have set a basic value for the 3 SMA at
-200
-400
-600
We will use an oscillator for entries which is not mine. Link ->
The oscillator mentioned above is just for visualization purposes, You do not need to get the signals, but You can see how scripts are generated with different values.
When the price above/below all the 3 SMA and oscillator crosses above/below "value you set" - You will get the buy or sell signal.
Your stop will be where the slowest SMA is.
Pyramiding is set for 10.
You can manually set 3 take profit and quantity levels.
Basic values are 1 %, 2 %, and 6 % for taking profits - You can change it based on how volatile the asset is.
Basic quantity values are 30 % at each level.
Hope You find it useful :)

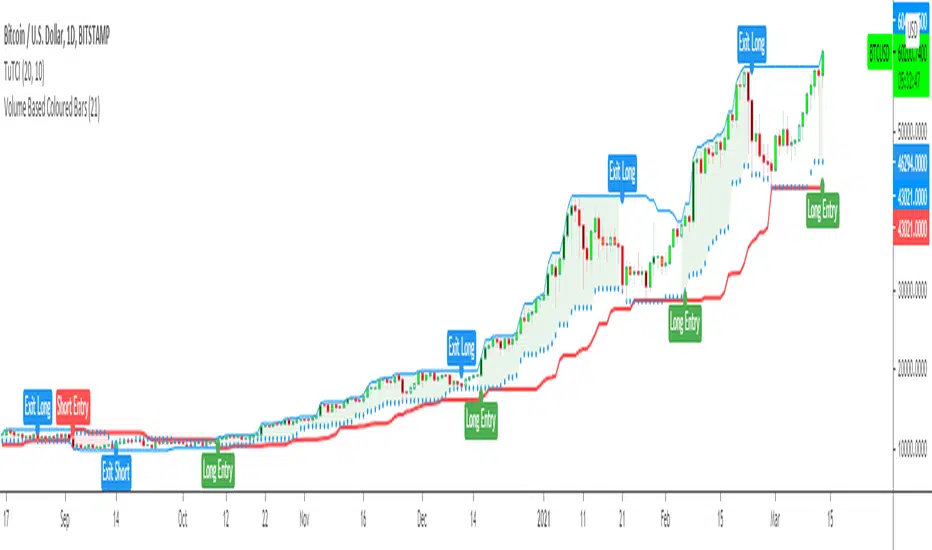
Turtle Trade Channels Indicator TUTCILegendary trade system which proved that great traders can be made, not born.
Turtle Trade Experiment made 80% annual return for 4 years and made 150 million $
Turtle Trade trend following system is a complete opposite to the "buy low and sell high" approach.
This trend following system was taught to a group of average and normal individuals, and almost everyone turned into a profitable trader.
They used the basis logic of well known DONCHIAN CHANNELS which developed by Richard Donchian.
The main rule is "Trade an 20-day breakout and take profits when an 10-day high or low is breached ". Examples:
Buy a 20-day breakout and close the trade when price action reaches a 10-day low.
Go short a 20-day breakout and close the trade when price action reaches a 10-day high.
In this indicator,
The red line is the trading line which indicates the trend directio n:
Price bars over the trend line indicates uptrend
Price bars under the trend line means downtrend
The dotted blue line is the exit line.
Original system is:
Go long when the price High is equal to or above previous 20 day Highest price.
Go short when the price Low is equal to or below previous 20 day Lowest price.
Exit long positions when the price touches the exit line
Exit short positions when the price touches the exit line
Recommended initial stop-loss is ATR * 2 from the opening price.
Default system parameters were 20,10 and 55,20.
Original Turtle Rules:
To trade exactly like the turtles did, you need to set up two indicators representing the main and the failsafe system.
Set up the main indicator with EntryPeriod = 20 and ExitPeriod = 10 (A.k.a S1)
Set up the failsafe indicator with EntryPeriod = 55 and ExitPeriod = 20 using a different color. (A.k.a S2)
The entry strategy using S1 is as follows
Buy 20-day breakouts using S1 only if last signaled trade was a loss.
Sell 20-day breakouts using S1 only if last signaled trade was a loss.
If last signaled trade by S1 was a win, you shouldn't trade -Irregardless of the direction or if you traded last signal it or not-
The entry strategy using S2 is as follows:
Buy 55-day breakouts only if you ignored last S1 signal and the market is rallying without you
Sell 55-day breakouts only if you ignored last S1 signal and the market is pluging without you
You can Highlight the chart with provided trade signals:
Green background color when Long
Red background color when Short
No background color when flat
WARNING: TURTLE TRADE STOP or ADDING more UNITS RULES ARE NOT INCLUDED.
Author: Kıvanç Özbilgiç
Also you can show or hide trade signals with the button on the settings menu
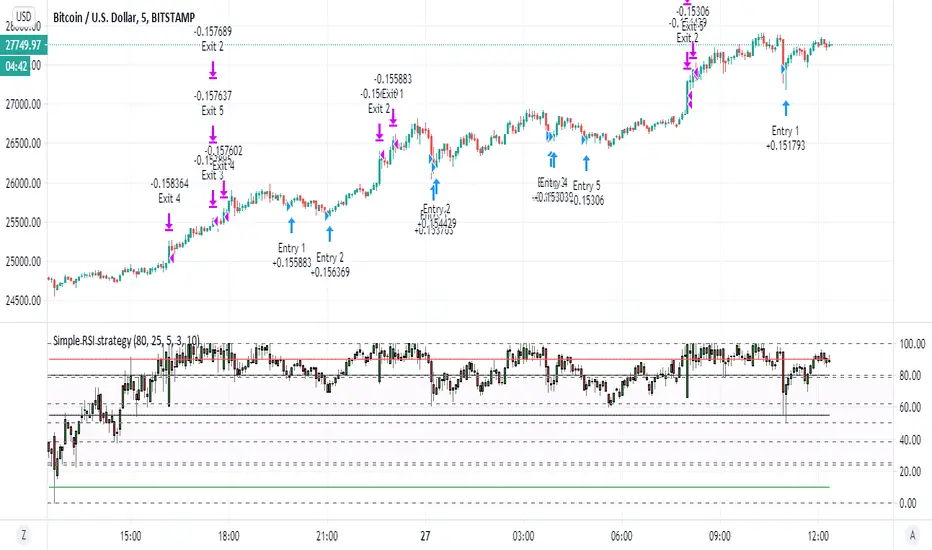
Simple RSI strategyso this script just take it as teaching how to make easy strategy
many time we try complex one and we fail
thanks to coinrule for his very smart method of pyramid
i just here in this very simple rsi strategy want to show how even lame strategy like RSI can be very profitable:)
1. we exit by take profit
2. we make sure that for exit by take profit the stop loss will be far lets say 10% or more
3. this shit only work good in up trending markets:)
why regular rsi strategy not working? because the exit is shity ... it depend on false top that based on RSI above 70 or 80 in general.
in bullish state this will exit us faster then we desire and will cost us loss . in bearish state rsi will not go so high and we exit too late so the stop loss is our our only saver
here by exiting by% we get much better results
so what happen if the trend is bearish? you can can try to do the same just reverse order to create more shorts (sometime it work sometime is not)
end conclusion in bullish trending market even shifty strategy is good
the only reason this one work is actually because of the script of coinrule so i want to thank him on this
happy new year to all TV members
KISS Strategy: SMA + EMA//Hello my fellow investors
//I am creating a simple non-cluttered strategy that uses 3(+1) simple means to determine: viability, entry, and exit
//1) Has a consistent trend been maintained for several days/weeks
//2) SH SMA crossover LG SMA = Bullish entry/LG SMA crossover SH SMA = Bearish entry
//3) Use the Slope factor & Weeks in Trend (WiT) to dertermine how strong of an entry signal you are comfortable with
//4) Exit position based on next SMA cross and trend reversal or stop loss%
//3+1) For added confidence in trend detection: Apply MACD check - buy--> MACD line above signal line and corssover below histogram \\ sell --> MACD line below signal line and crossover above histogram.
//*)This code also allows you to determine your desired backtesting date compliments of alanaster
The chart shown has:
Starting Capital: $10,000
Investment percent per trade: 1.5%
Stop Loss: 20%
Take Profit: 100%
Bjorgum Triple EMA Strat-This script uses a triple EMA strategy to establish trend direction and reversal points
-Inputs are smoothed with Heiken Ashi values to reduce whipsaws, while providing timely execution
-Buy and sell indications are dictated by bar color
-Bar color is dictated by the candle close value in relation to the EMAs, specifically the faster of the 3
(If candle closes above or below the fast and intermediate averages, a buy or sell signal is indicated by bar color change)
-If the close falls between the two a cautionary signal is given. The viewer can hold, or take profit, or evaluate other indicators for clues
-Best results are obtained when coupled with Bjorgum TSI and Bjorgum RSI for confirmation of signals (see TradingView profile)
@Bjorgum on Stocktwits

Multi Time Frame Buy the Dips (by Coinrule)Buying the dips is a relatively easy automated trading strategy that can return impressive profits, especially during uptrend times. Not all price drops are for buying, though. This trading system is based on a multi time frame buy-the-dip approach to optimize each trade.
The strategy catches sudden price drops on a 1-hr time frame when the price increases significantly in the last 12 hours. During steep uptrends, profit-taking price actions result in flash crashes that provide great opportunity to enter at convenient prices.
Buy Condition
The setup of the script is optimized on a 30 min time frame. You can adjust the parameters to fit different time frames.
The system gets a buy signal when
- the price drops 1% from the two previous candles (1 hour time frame = two 30-min candles)
- the price is up 3% from the last 12 hours (twenty-four 30-min candles equal the desired time frame)
Sell Condition
Each trade comes with a stop loss of 3% and a take profit of 4%.
This setup has been optimized, running over 150 backtests on more than 20 different crypto trading pairs.
The strategy assumes each order to trade 30% of the available capital. A trading fee of 0.1% is taken into account. The fee is aligned to the base fee applied on Binance, which is the largest cryptocurrency exchange.

Buy the Dips (by Coinrule)Taking your first steps into automated trading may be challenging. Coinrule's mission is to make it as easy as possible, also for beginners.
Here follows the best trading strategy to get started with Coinrule. This strategy doesn't involve complex indicators, yet was proved to be effective in the long term for many coins. Results seem to be improved when trading a coin vs Bitcoin.
The strategy buys the dips of a coin to sell with a profit. A stop-loss protects every trade.
Crypto markets offer high volatility and, thus, excellent opportunities for trading. Excluding times of severe downtrend, buying the dip is a simple and effective long-term trading strategy. The buy-signal is set to a 2% drop in a 30-minutes time frame.
Each trade comes with a take profit and a stop loss. Both set at 2%.
You can adjust these percentages to the market volatility as an advanced setup. You can backtest the outcomes using the backtesting tool from Tradingview
The strategy assumes each order to trade 30% of the available capital. A trading fee of 0.1% is taken into account. The fee is aligned to the base fee applied on Binance, which is the largest cryptocurrency exchange.

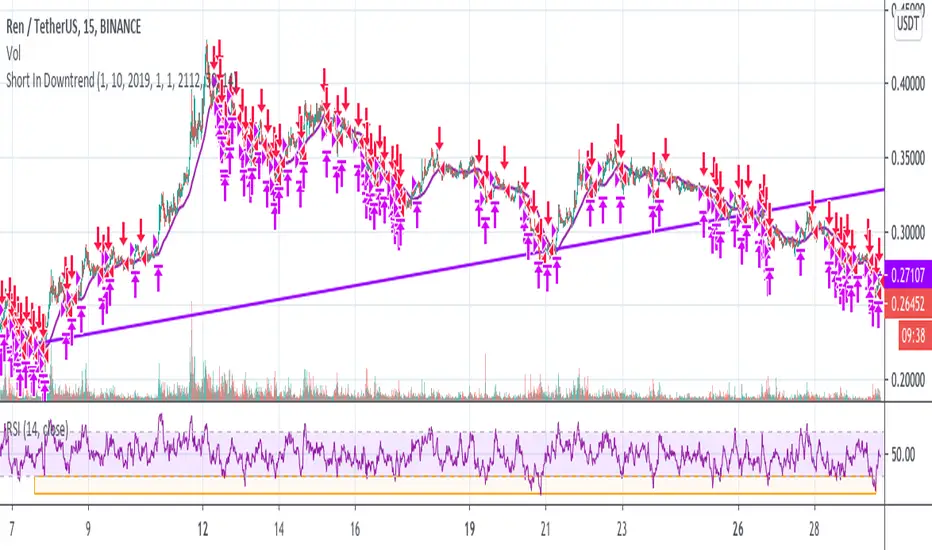
Short In Downtrend Below MA100 (Coinrule)This is a simple strategy to take advantage of downtrends. It's useful to run such a strategy as a hedge in times of market uncertainty.
The Sell Condition - Entry
The sell signal triggers when:
the coin has MA (100) greater than the price in a timeframe of 15 minutes, meaning that the coin is in a short-term downtrend.
the coin has an RSI greater than 30 in a timeframe of 15 minutes, indicating that it didn't reach oversold conditions yet, so there is still room for a further price drop.
On Coinrule, you can launch the strategy on real market conditions, setting up multiple sequential sell orders. The strategy would keep selling while the price stays below the MA(100). In that case, it's advisable to set low amounts for the sell orders. the position will grow gradually while the downtrend intensifies. Set a minimum time interval between the sell orders will also help to have control over the overall position size.
The Buy Condition - Exit
The bot connects to each trade a stop loss and a take profit. The percentages are optimized for short term trades on mid-cap coins. You can adjust the percentages depending on the specific coin you are trading. A ratio of 1:1.5 between the stop loss and the take profit could work as the strategy trades in the same direction of the trend.
Stop loss at 3% from the entry price
Take profit at 2% from the entry price
A slightly larger stop loss allows tolerating more volatility to reduce the case of stops triggering when it shouldn't.
[blackcat] L2 Ehlers ITrendline Trigger Trend-Following SystemLevel: 2
Background
John F. Ehlers introuced the Instantaneous Trendline and the Trigger of the trend-following system in his "Cybernetic Analysis for Stocks and Futures" chapter 3 on 2004.
Function
The process for creating a trendfollowing trading system from the indicators is simple. One unique aspect of the code is that the ITrend is forced to be a finite impulse response (FIR)-smoothed version of price for the first seven bars of the calculation.
This initialization is included to cause the ITrend to converge more rapidly to its correct value from the beginning transient. The strategy enters a long position when the trigger crosses over the Instantaneous Trendline and enters a short position when the trigger crosses under the Instantaneous Trendline. However, an effective trading system is more than following a simple set of indicators.
First, experience has shown that greater profits result from using limit orders rather than market orders or stop orders. Market orders are selfexplanatory. Stop orders mean the market must be going in the direction of the trade before the order is filled. For example, for long-position trades, the stop order must be placed above the current price. Thus, the price must increase from its current level before you get stopped into the long-position trade. This means you necessarily give up some of the profits you would otherwise have gotten if you had entered on a market order at the instant of your signal. You can lose additional profits from stop orders due to slippage.
Key Signal
Trigger ---> trend-following system fast line
ITrend ---> trend-following system slow line
Pros and Cons
100% John F. Ehlers definition translation of original work, even variable names are the same. This help readers who would like to use pine to read his book. If you had read his works, then you will be quite familiar with my code style.
Remarks
The 22th script for Blackcat1402 John F. Ehlers Week publication.
Readme
In real life, I am a prolific inventor. I have successfully applied for more than 60 international and regional patents in the past 12 years. But in the past two years or so, I have tried to transfer my creativity to the development of trading strategies. Tradingview is the ideal platform for me. I am selecting and contributing some of the hundreds of scripts to publish in Tradingview community. Welcome everyone to interact with me to discuss these interesting pine scripts.
The scripts posted are categorized into 5 levels according to my efforts or manhours put into these works.
Level 1 : interesting script snippets or distinctive improvement from classic indicators or strategy. Level 1 scripts can usually appear in more complex indicators as a function module or element.
Level 2 : composite indicator/strategy. By selecting or combining several independent or dependent functions or sub indicators in proper way, the composite script exhibits a resonance phenomenon which can filter out noise or fake trading signal to enhance trading confidence level.
Level 3 : comprehensive indicator/strategy. They are simple trading systems based on my strategies. They are commonly containing several or all of entry signal, close signal, stop loss, take profit, re-entry, risk management, and position sizing techniques. Even some interesting fundamental and mass psychological aspects are incorporated.
Level 4 : script snippets or functions that do not disclose source code. Interesting element that can reveal market laws and work as raw material for indicators and strategies. If you find Level 1~2 scripts are helpful, Level 4 is a private version that took me far more efforts to develop.
Level 5 : indicator/strategy that do not disclose source code. private version of Level 3 script with my accumulated script processing skills or a large number of custom functions. I had a private function library built in past two years. Level 5 scripts use many of them to achieve private trading strategy.

72s: Adaptive Hull Moving Average+One challenging issue for beginner traders is to differentiate market conditions, whether or not the current market is giving best possibility to stack profits, as earliest, in shortest time possible, or not.
On intraday, we've seen some big actions by big banks are somewhat can be defined --or circling around-- by HMA 200 . I've been thinking on to make the visuals more conform to price dynamics (separating major movement and minor noise) to get clearer signs of when it starts to happen. So it will be easier to see in a glance when the strength starts really taken place, with less cluttered chart.
This Adaptive HMA is using the new Pine Script's feature which now support Dynamic Length arguments for several Pine functions. ( read: www.tradingview.com). It hasn't support the built-in HMA() directly, but thankfully we can use its wma() formula to construct. (Note: I tweaked a bit HMA formula already popular here by using plain int() instead of round() on its wma's length, since I find it precisely match tradingview's built-in HMA).
You can choose which aspect the Adaptive HMA period will adapt to.
In this study I present it with two options: Volume and Volatility . It will "moves" faster or slower depends on which situation the aspect is currently into. ie: When volume is generally low or volatile readings is not there, price won't move very much, so the adapting MA will slow down by dynamically lengthen the lookback period, and vice versa, and so on.
Colour-markings in the Adaptive resembles which situation explained above. In addition, I also combine it with slope calculation of the MA to help measuring trend-strength or sideway/choppy conditions.
This way when we use it as dynamic support/resistance it will be more visually-reliable.
Secondly, and more important, it might help us traders with better probability info of whether or not a trade should even worth to be made . ie: If in the mean time market won't give much movement, any profit would also only as much. In most cases, we might better save our dime for later or place it somewhere else.
HOW TO USE:
Aside from better dynamic support/resistance and clearer breakout confirmation, MA is coloured as follow:
YELLOW:
Market is in consolidation or flat. Be it sideways, choppy, or in relatively small movements. If it shows up in a trending market, it may be an earlier sign that current trend might about to change its direction, or confirming a price broke-out to another side.
LIGHT GREEN or LIGHT RED:
Tells if a trend is forming but still relatively weak (or getting weaker), as it doesn't have volume or volatility to support.
DARKER GREEN ot DARKER RED:
This is where we can expect some good and strong price movement to ride. If it's strong enough, many times it marks a start of new long-lasting major trend.
SETTINGS:
Charger:
Choose which aspect your HMA should plug itself into, thus it will adapt to it.
Minimum Period, Maximum Period:
172 - 233 is just my own setting to outmatch the static HMA 200 for intraday. I find it --in my style of trading-- best in 15m tf in almost any pair, and 15m to 1H for some stocks. It also works nicely with conventional EMA 200, sometimes as if they somewhat work hand-in-hand in defining where the price should go. But you can, ofcourse, experiment with other ranges, broader or narrower. Especially if you already have an established strategy to follow to. As you might do with:
Consolidation area threshold:
This has to do with slope calculation. The bigger the number means your MA needs bigger degree to define the market is out of flat (yellow) area. This can be useful if needed to lighten up the filter or vice-versa.
Background colouring:
Just another colouring to help highlighting the difference in market conditions.
ALERTS:
There are two alerts:
Volume Break: when volume is breaking up above average, and
Volatility Meter: when the market more likely is about to have its moment of the big wiggling brush.
USAGE:
Very very nice BUY entry to catch big up-movement if:
1. Price is above MA. (It is best when price is also not to far distance from the MA, or you can also use distance oscillator to help out too)
2. HMA's color is in darker green. Means it's on the charging plug with your chosen aspect.
3. RSI is above 50. This is to help as additional confirmation.
Clear SELL entry signal is same as above, just the opposite.
-------------------------------------------------------
Note:
Lower timeframe of course means more noise to be filtered. Depends on the instrument, you might need to tweak the settings a bit till it conform nicely and shows lots of good trades in history. Here's another example on GBPUSD 5m timeframe:
For exit/take-profit point, you can use a second faster period static HMA. Or you can also use RSI. Here's an example:
Don't get me wrong, on few occasions I found it's still best using static MA to spot fakeouts, breakouts, etc, especially ones that's been already use widely. If that's the case or price actions seems suspicious, simply put the same value for minimum and maximum period settings, and there you have the original HMA with extra features.
For developer, check in the code if you need to customise your own charger.
-------------------------------------------------------
That's it. Hopefully this Adaptive HMA+ could at least be a good sidekick to your own strategy, as it does mine. ;)

[blackcat] L1 Trading Risk Assessment Indicator Level: 1
Background
Risk assessment is a general term used in many industries to determine the likelihood of losing an asset, loan, or investment. Risk assessment is important in determining how profitable a particular investment is and which techniques are best for risk mitigation. It shows the upward reward versus the risk profile. Risk assessment is important in determining the rate of return an investor would need to earn in order to consider an investment as worth the potential risk.
Function
L1 Trading Risk Assessment Indicator provides a trading risk evaluation mechanism that follows the megatrend. By defining transaction risk as 4 levels: highly risky, risky, safe, and highly safe, the current bar’s evaluation value can be compared with historical bar data to understand the current level of trading risk and the level of trading risk Trend.
Key Signal
h1~h5 --> trading risk level threshold, which can be adjusted according different markets.
currentsafetylevel --> it indicates current bar risk assessment result
Pros and Cons
Pros:
1. according risk level, proper position size can be adjusted
2. know global trend and select propoer time to exit
Cons:
1. no exact long and short entry are disclosed
2. different markets require different thresholds
Remarks
An improved version of KDJ with less satration observed.
Readme
In real life, I am a prolific inventor. I have successfully applied for more than 60 international and regional patents in the past 12 years. But in the past two years or so, I have tried to transfer my creativity to the development of trading strategies. Tradingview is the ideal platform for me. I am selecting and contributing some of the hundreds of scripts to publish in Tradingview community. Welcome everyone to interact with me to discuss these interesting pine scripts.
The scripts posted are categorized into 5 levels according to my efforts or manhours put into these works.
Level 1 : interesting script snippets or distinctive improvement from classic indicators or strategy. Level 1 scripts can usually appear in more complex indicators as a function module or element.
Level 2 : composite indicator/strategy. By selecting or combining several independent or dependent functions or sub indicators in proper way, the composite script exhibits a resonance phenomenon which can filter out noise or fake trading signal to enhance trading confidence level.
Level 3 : comprehensive indicator/strategy. They are simple trading systems based on my strategies. They are commonly containing several or all of entry signal, close signal, stop loss, take profit, re-entry, risk management, and position sizing techniques. Even some interesting fundamental and mass psychological aspects are incorporated.
Level 4 : script snippets or functions that do not disclose source code. Interesting element that can reveal market laws and work as raw material for indicators and strategies. If you find Level 1~2 scripts are helpful, Level 4 is a private version that took me far more efforts to develop.
Level 5 : indicator/strategy that do not disclose source code. private version of Level 3 script with my accumulated script processing skills or a large number of custom functions. I had a private function library built in past two years. Level 5 scripts use many of them to achieve private trading strategy.

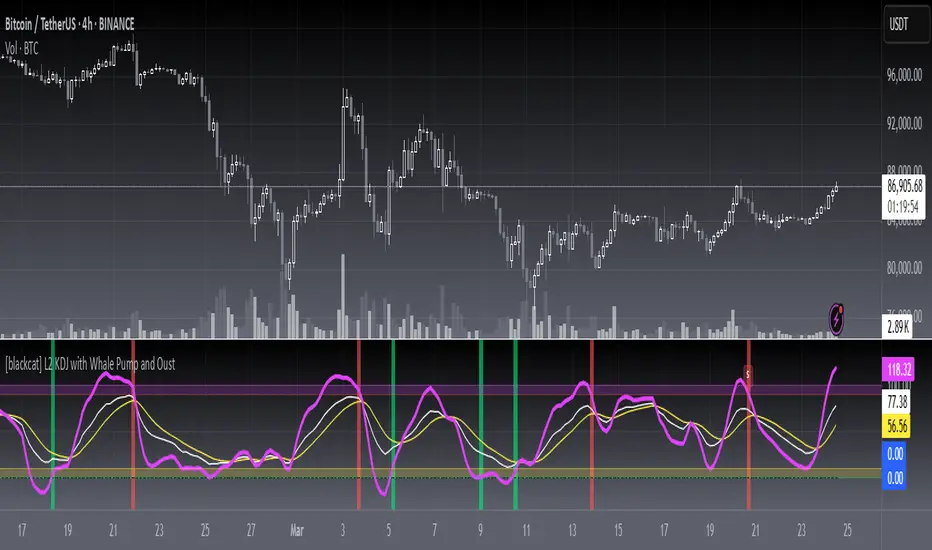
[blackcat] L2 KDJ with Whale Pump and OustLevel: 2
Background
One of the biggest differences between cryptocurrency and traditional financial markets is that cryptocurrency is based on blockchain technology. Individual investors can discover the direction of the flow of large funds through on-chain transfers. These large funds are often referred to as Whale. Whale can have a significant impact on the price movements of cryptocurrencies, especially Bitcoin . Therefore, how to monitor Whale trends is of great significance both in terms of fundamentals and technical aspects.
The KDJ oscillator display consists of 3 lines (K, D and J - hence the name of the display) and 2 levels. K and D are the same lines you see when using the stochastic oscillator. The J line in turn represents the deviation of the D value from the K value. The convergence of these lines indicates new trading opportunities. Just like the Stochastic Oscillator, oversold and overbought levels correspond to the times when the trend is likely to reverse.
Function
L2 KDJ with Whale Pump and Oust is a composite indicator that combines both KDJ and Whale Pump and Oust detector. By virtue of this, fake signal of KDJ can be filtered out to some degree.
Key Signal
whalepump --> whale buy behavior will be detected and displayed in green histograms
oust --> after whale buy behavior, there usually a oust action from whale to drive out profitable orders to reduce the selling pressure of subsequent pull ups. This oust will be detected and displayed in red histograms
k --> k value of a stochastic oscillator
d --> d value of a stochastic oscillator
j --> the deviation of the d value from the d value of a stochastic oscillator
Pros and Cons
Pros:
1. filter out KDJ fake signal by introducing whale pump/oust detector
2. J value can be used to detect overbought and oversold regions
Cons:
1. It works better in small time frame and sideways. Extreme long or short conditions may cause KDJ staturate.
2. It can only indicate in current time frame, larger time frame trend info is missing.
Remarks
An improved version of L2 KDJ with Whale Pump Detector by adding oust function. Works fine in 15mins time frame.
Readme
In real life, I am a prolific inventor. I have successfully applied for more than 60 international and regional patents in the past 12 years. But in the past two years or so, I have tried to transfer my creativity to the development of trading strategies. Tradingview is the ideal platform for me. I am selecting and contributing some of the hundreds of scripts to publish in Tradingview community. Welcome everyone to interact with me to discuss these interesting pine scripts.
The scripts posted are categorized into 5 levels according to my efforts or manhours put into these works.
Level 1 : interesting script snippets or distinctive improvement from classic indicators or strategy. Level 1 scripts can usually appear in more complex indicators as a function module or element.
Level 2 : composite indicator/strategy. By selecting or combining several independent or dependent functions or sub indicators in proper way, the composite script exhibits a resonance phenomenon which can filter out noise or fake trading signal to enhance trading confidence level.
Level 3 : comprehensive indicator/strategy. They are simple trading systems based on my strategies. They are commonly containing several or all of entry signal, close signal, stop loss, take profit, re-entry, risk management, and position sizing techniques. Even some interesting fundamental and mass psychological aspects are incorporated.
Level 4 : script snippets or functions that do not disclose source code. Interesting element that can reveal market laws and work as raw material for indicators and strategies. If you find Level 1~2 scripts are helpful, Level 4 is a private version that took me far more efforts to develop.
Level 5 : indicator/strategy that do not disclose source code. private version of Level 3 script with my accumulated script processing skills or a large number of custom functions. I had a private function library built in past two years. Level 5 scripts use many of them to achieve private trading strategy.
[blackcat] L1 Whale Jumping out of the OceanLevel: 1
Background
One of the biggest differences between cryptocurrency and traditional financial markets is that cryptocurrency is based on blockchain technology. Individual investors can discover the direction of the flow of large funds through on-chain transfers. These large funds are often referred to as Whale. Whale can have a significant impact on the price movements of cryptocurrencies, especially Bitcoin . Therefore, how to monitor Whale trends is of great significance both in terms of fundamentals and technical aspects.
We often see whales suddenly jump out of the ocean and then set off huge waves. What we need to do is to surf the wave according to the trend after the whale jumps out of the sea. This is really an exciting sport!
Function
By modeling the behavior of Whale and individuals (Surfers), L1 Whale Jumping out of the Ocean can not only simply describe the behavior trends of Whale and individuals, but also describe the shape of waves generated by the whale jump. Individual traders need to follow the wave trend to take profit.
NOTE: white line and yellow candles represent whale appears but it CANNOT indicate the direction as PUMP or DUMP. This indicator is one of the whale series. It is featured by vividness. A technical indicator is drawn as ocean (momentum in blue and aqua), whale (whale PUMP/DUMP in white,yellow, red, fuchsia and green), huge wave (mid-term trend or swing trend in aqua and blue).However, it does not accurately generate buying and selling points.
Key Signal
var01 --> huge wave caused by whale jump. it is used to confirm whale jump and describe the trend of wave for surfers.
var02 --> whale move signal
var12 --> whale move signal
var28 --> high confidence level of huge whale move
dynabot --> deep ocean (dynamic bottom)
Pros and Cons
Pros:
1. Detect Whale pump and dump and the strength of huge wave.
2. Vividly compare the market movement to a huge wave caused by a whale jumping out of the sea.
3. When it resonante with buy or sell signal from other independent indicators, it has higher confidence level.
Cons:
1. No exact long and short entries.
2. It is sensitive and may have noise inside and generate fake entry signal.
Remarks
Please do not think that this is just a technical indicator, this is a documentary about whales.
Readme
In real life, I am a prolific inventor. I have successfully applied for more than 60 international and regional patents in the past 12 years. But in the past two years or so, I have tried to transfer my creativity to the development of trading strategies. Tradingview is the ideal platform for me. I am selecting and contributing some of the hundreds of scripts to publish in Tradingview community. Welcome everyone to interact with me to discuss these interesting pine scripts.
The scripts posted are categorized into 5 levels according to my efforts or manhours put into these works.
Level 1 : interesting script snippets or distinctive improvement from classic indicators or strategy. Level 1 scripts can usually appear in more complex indicators as a function module or element.
Level 2 : composite indicator/strategy. By selecting or combining several independent or dependent functions or sub indicators in proper way, the composite script exhibits a resonance phenomenon which can filter out noise or fake trading signal to enhance trading confidence level.
Level 3 : comprehensive indicator/strategy. They are simple trading systems based on my strategies. They are commonly containing several or all of entry signal, close signal, stop loss, take profit, re-entry, risk management, and position sizing techniques. Even some interesting fundamental and mass psychological aspects are incorporated.
Level 4 : script snippets or functions that do not disclose source code. Interesting element that can reveal market laws and work as raw material for indicators and strategies. If you find Level 1~2 scripts are helpful, Level 4 is a private version that took me far more efforts to develop.
Level 5 : indicator/strategy that do not disclose source code. private version of Level 3 script with my accumulated script processing skills or a large number of custom functions. I had a private function library built in past two years. Level 5 scripts use many of them to achieve private trading strategy.

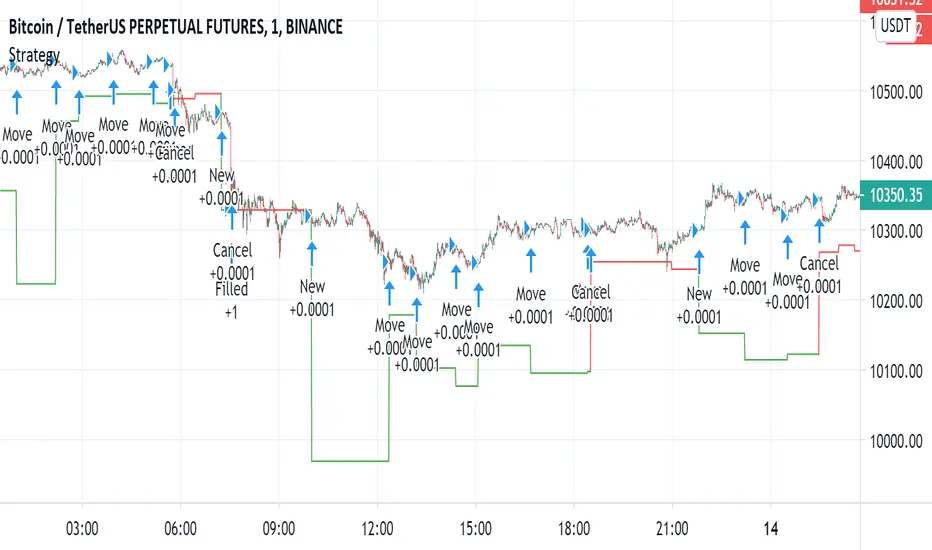
Automated - Fibs with Limit only ordersAutomated - Fibs with Limit only orders
This script was designed to demonstrate how you can use a single alert to move your limit orders around.
It is not meant to be traded live and has been built to work with Binance Futures Testnet.
You will notice a lot of plots with 5 different titles.
New = Place your limit buy at a fixed-price.
Move = Cancel the current limit buy and place it at the new fixed-price.
Filled = Cancel any limit closes and places them anew based on the new average and take profit.
Cancel = Cancels exisiting limit buys.
Cloes All = Limit close filled, no commands necessary.
The default quantity in the command is the minimum order size on Binance.
Settings
Live
- If enabled it will only place trades after the "Stat Timestamp + Start Delay" that you provide.
Start Timestamp
- Use something similar to epochconverter to get the current timestamp.
Start Delay
- Gives you 1 minute by default to start the script and create your alert before it begins looking for a new entry.
Leverage
- Default 1. Affects the "Take Profit and DCA When" Settings.
Take Profit %
- This is the percentage above the current average you'd like to place your position close at.
DCA When %
- The percentage below your last entry that you're willing to buy again.
Note: This strategy has no stop-loss and pyramiding is enabled. It is not built for, or recommended to run live.
I hope this opens some doors and helps advance your personal trading system.
Good luck and happy scripting!